How hazel trees stop squirrels eating all the hazel nuts, using auto-correlation in pollen
Trees like hazel reproduce via nuts that are also a food source for squirrels. But squirrels don’t eat all of the nuts they find, they also bury some as a winter cache. This hoarding of nuts that are both a food for squirrels and the seed for new hazel trees leads to an interesting tension in the relationship between the two species:
On the one hand, hazel trees benefit from this hoarding, because squirrels usually forget to eat some of the cached nuts, which then grow into new trees. This means squirrels effectively disperse and plant trees in new places, as if they were gardeners that hazel trees pay by providing them with extra nuts.
On the other hand, if the squirrels do so well that their population expands too much, they could end up consuming the entire nut harvest - with none left over for hazel trees to reproduce.
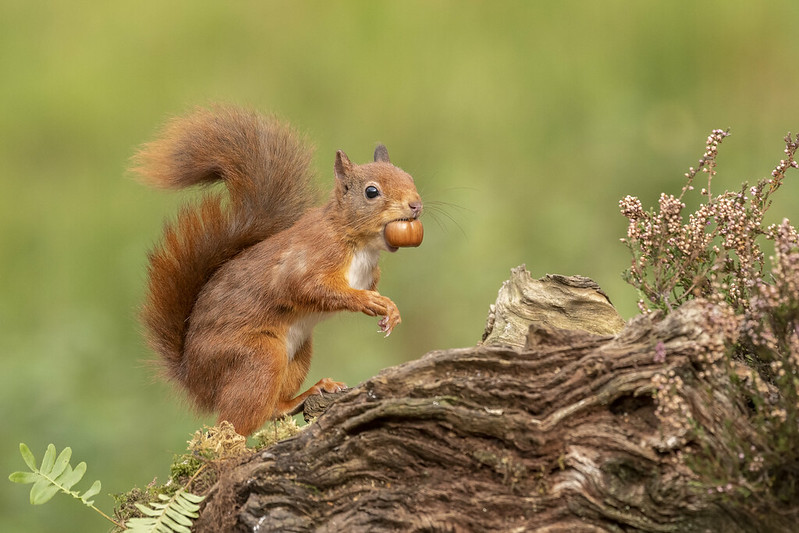
In this post, I will describe evolutionary strategies hazel trees use to shape their relationship with squirrels, and in which pollen plays a central role - and which is in fact reflected in the extreme variability of hazel pollen concentrations.
Nut tree species use a number of evolutionary strategies to shape their relationship with scatter-hoarding animals such as squirrels. For example, packaging nuts in a tough shell means squirrels have to use a certain amount of energy before they can eat them. As a result, once satiated, it makes sense for a squirrel to bury the nut rather than to it eat immediately.
Also, making the nuts extra large and nutritious means they are worth hiding them somewhere far from the tree - this increases the range over which the nuts get scattered.
But a key strategy involves the variation of pollen.
Hazel pollen concentrations are highly variable
Day-to-day variability of hazel pollen concentrations is huge - as shown for the 2016 season in the first panel in this graphic.
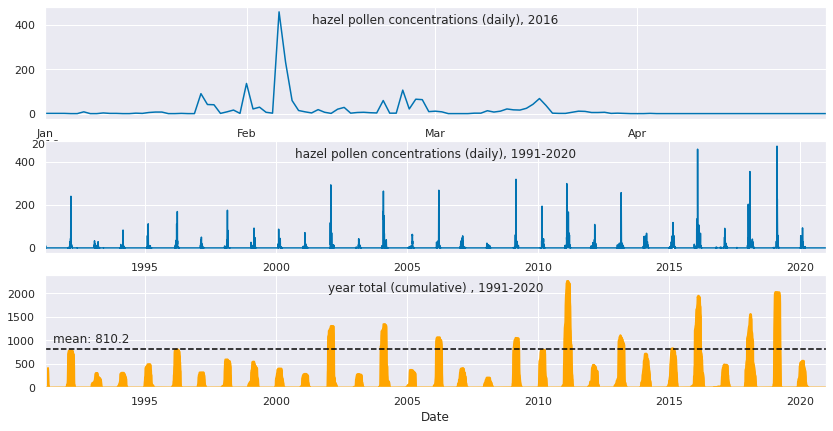
If we take a step back and look at the variability from season to season, we can see it is also highly variable.
The daily concentrations of hazel pollen in the middle panels emphasise the seasonal peak concentrations. To see the amount of pollen in each season, we can visualise the 60-day cumulative sum of daily concentrations (bottom panel, shown over the 3 decades of the data set).
The year totals are quite variable, but less random: each of the exceptionally high years (2011, 2016, 2019) is followed by an exceptionally low year. (Another noticeable pattern is a trend towards higher pollen amounts - both the highest and lowest season totals appear to go up. But more on that another time.)
This interesting pattern is not simply regression toward the mean, because the lows following the exceptional highs tend to be exceptionally low too, rather than average.
Mast seeding: a year of plenty followed by meagre harvests
Instead, it is a consequence of a well-known phenomenon called mast seeding:
Every 3-5 years, hazel trees produce a vast crop of nuts, much larger than in an average year. For squirrels, this means they don’t just have plenty to eat - but there are also plenty of nuts left over to store.
This suits hazel trees, because it increases the chance that new seedlings will grow from nuts cached by squirrels.
What doesn’t suit hazel trees though, is when squirrels thrive too much : if all the nuts become squirrel food, the hazel trees can no longer reproduce.
To stop that from happening, the one year of plenty is typically followed by a meagre year. So, while squirrels will thrive during the mast seeding year as they are swamped with nuts, they will face starvation in the following season.
In this way hazel trees can prevent the squirrel population from expanding excessively - i.e. to a point where nut consumption by squirrels leaves too few over for the reproduction of the trees.
How do trees know it’s a mast seeding year?
Of course, for the hazel trees’ population control measures on squirrels to work, the variation from extremely large crops to meagre ones can’t happen at the level of the individual tree - mast seeding needs to be synchronised among all the trees in an area.
So how do hazel trees work out collectively which year they should produce an extra large harvest? It turns out that pollination plays a central role in this synchronisation.
Typically, trees produce an abundance of flowers, but pollen is the limiting factor.
As a result, in years with an abundance of pollen, an unusually large proportion of flowers are fertilised and mature into nuts. Since nut trees are wind- (rather than insect-) pollinated, years with a large increase in pollen concentrations can result in whole populations of nut trees in a large area (commonly whole continents) producing large increases in nut crops.
On the flip side, years with much lower pollen concentrations typically result in meagre nut crops because a large proportion of the flowers of the whole population of nut trees in a large area remain unfertilised.
And thus the mast seeding phenomenon is visible in the patterns of highly variable hazel pollen concentrations that occur 7-8 months before the nuts ripen.
Mast seeding results from patterns of negative autocorrelation in seasonal pollen concentrations
Interestingly this phenomenon doesn’t just happen in hazel trees but many trees that are wind pollinated. Also interestingly, it is to some degree synchronised between different tree species :
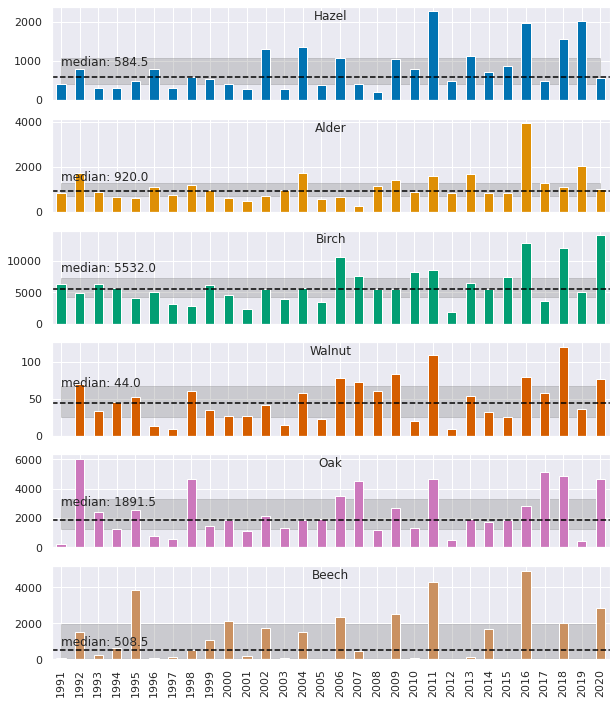
For most of these trees, 2016, 2011, 2018, 2006, were above-average while 2017, 2012, 2019, 2017 were below-average (with exceptions). The name for this type of pattern is negative autocorrelation or serial correlation: the total amount of pollen produced in a season is correlated with the amount of preceding seasons. And for seasons separated by one year (lag of 1), that correlation is negative: a high tends to be followed by a low, and vice-versa.
To quantify the strength of the negative autocorrelation, we can calculate the difference between each season and the preceding one, and generate an autocorrelation plot.
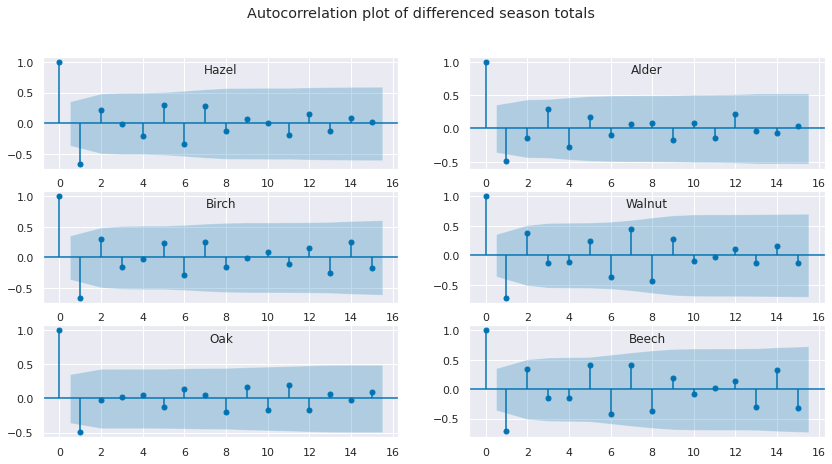
The plot shows autocorrelation for different lags: the correlation between one year and 1 year, 2,3,4,..15 years later. As expected, at lag 1, there’s a strong negative autocorrelation from about -0.5 to -0.7.
For most of the trees, lag 2 is positive, with some exceptions - but this is within the blue area that indicates autocorrelation values below the chosen threshold of statistical significance.
Interestingly, there is positive autocorrelation with lags 5 and 7, especially for hazel, walnut, beech. In other words, a season with high pollen tends to be followed by a high pollen season 5 and 7 years later ; a low pollen season tends to be followed by a low pollen season 5 and 7 years later. Similarly, there is negative autocorrelation with lags 6 and 8.
This means we’re not dealing with a simple up-down-up-down pattern, as one might expect from the negative autocorrelation with lag 1: with a simple up-down-up-down pattern, odd number lags would be negative, and even number lags would be positive. This could be part of the mast seeding pattern, but it could also simply be down to chance events in a relatively short series of 30 pollen seasons: 2006-2011-2016 are 5 years apart, 2011-2018 are 7 years apart.
Pollen totals are skewed and highly variable
So there are patterns in annual pollen production because trees such as hazel use wind pollination to produce extra-large nut crops in a synchronised manner. How does this affect the distribution of pollen APIs? => boxplot
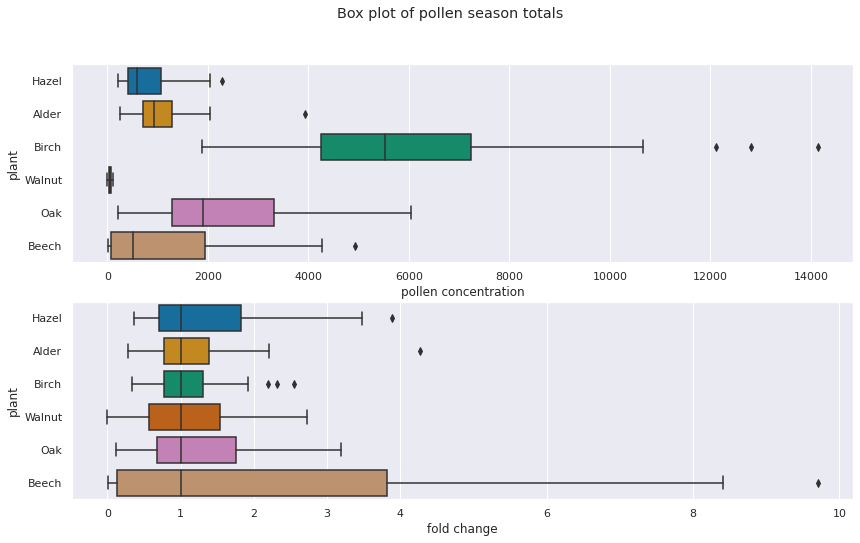
In the boxplot, most tree species have outliers (beyond 1.5x IQR), as indicated by the separate dots - these correspond to the mast seeding years.
We can also see that the distribution is right-skewed: the median is not in the middle of the box but on the right ; the right whisker is longer ; and all outliers are on the right.
To see the skewness better, and be able to compare the distributions of the different trees, we can normalise the data. To do this, we can divide each season total by the median of the observations. This removes the effect of the vast differences in pollen production between, for example, walnut and birch. 1 is now the value of a typical (median) year, and the values express the fold change in other years compared to the median.
What this shows is that in high-pollen years, trees don’t just increase pollen by a little bit, they really go for it: they multiply their pollen output by 2,3,4 fold, and in the case of beech almost 10-fold.
Why does this matter? The variation of tree pollen is not simply the result of fluctuations - trees appear to actively increase the production of pollen in certain years to control mast seeding. So any model attempting to predict pollen concentrations will struggle unless it has some handle on mast-seeding.
summary:
Trees such as hazel try to shape their relationship with scatter-hoarders such as squirrels through mast seeding.
Pollination is a key determinant of mast seeding : to produce an abundance of hazel nuts (or other seeds) in autumn, hazel trees fertilise an abundance of tree flowers in winter.
Since mast-seeding is in part controlled by pollination levels, there are characteristic patterns are visible in the annual total of pollen concentrations: negative auto-correlation with lag 1 ; and right-skewed distribution. This extreme variability in pollen concentrations is an issue if we want to model pollen.
Links
How plants manipulate the scatter-hoarding behaviour of seed-dispersing animals.
pic by Caroline Legg (CC BY 2.0)