How hazel trees stop squirrels eating all the hazel nuts, using auto-correlation in pollen

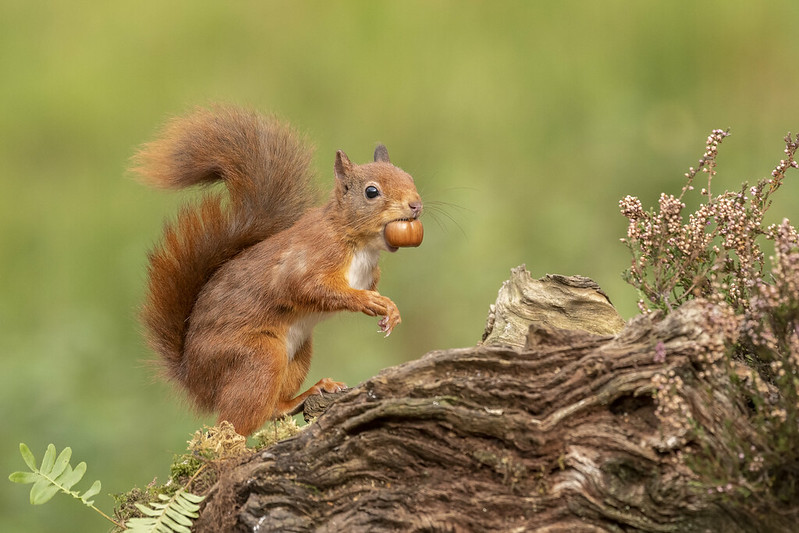
Trees like hazel reproduce via nuts that are also a food source for squirrels. But squirrels don’t eat all of the nuts they find, they also bury some as a winter cache. This hoarding of nuts that are both a food for squirrels and the seed for new hazel trees leads to an interesting tension in the relationship between the two species:

On the one hand, hazel trees benefit from this hoarding, because squirrels usually forget to eat some of the cached nuts, which then grow into new trees. This means squirrels effectively disperse and plant trees in new places, as if they were gardeners that hazel trees pay by providing them with extra nuts.

On the other hand, if the squirrels do so well that their population expands too much, they could end up consuming the entire nut harvest - with none left over for hazel trees to reproduce.
jpg

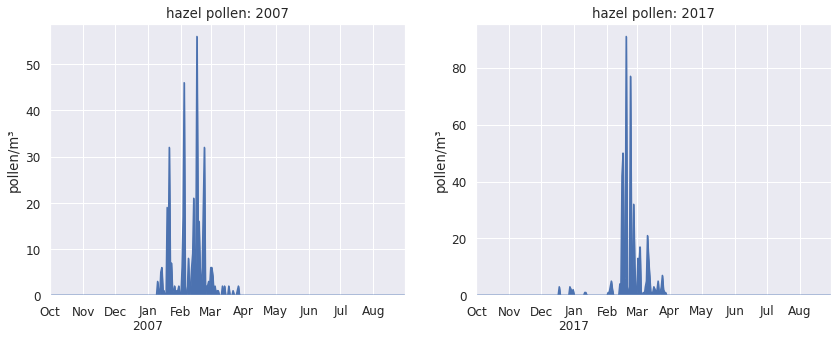
In this post, I will describe evolutionary strategies hazel trees use to shape their relationship with squirrels, and in which pollen plays a central role - and which is in fact reflected in the extreme variability of hazel pollen concentrations.
Read more · 9 min read

How to find a needle in the haystack, using z-scores and Q-Q plots

Outliers caused by typos can profoundly distort a dataset if they generate an impossibly large or small value. The same property also makes them easy to identiy during data cleaning.

But what if a typo in a time-series is exceptional not due to its value, but due to the time when it occurs? Such small errors can be hard to identify, especially in a time-series such as 30 years of daily pollen counts. In this post, I show an approach I used for finding the needle in a haystack - or a handful of pollen grains outside of the hayfever season.

png

Read more · 10 min read

What does a pollen season look like?

Plants release pollen in a phenological process : the pollen season. As pollen allergy suffers know, these seasons repeat every year in a similar way - but there is also great variability, at the level of daily observations, between seasons and between plants. This post presents ways of visualising pollen time-series data so to gain a sense of how a pollen season unfolds as well as how pollen seasons vary.

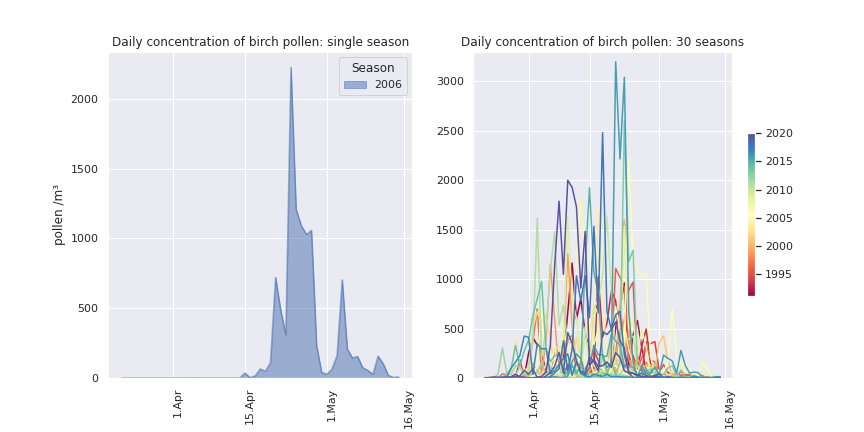
Pollen concentrations vary from day to day. On the left are daily observations of the concentration of birch pollen in 2006. It starts in mid-April, it fades out from mid-May. The bulk of pollen is seen in the second half of April. This is the main pollen season: people allergic to birch pollen will see strong symptoms when the concentration is above 50 or 100 pollen grains /m³.

png

Read more · 5 min read

A lockdown project that became something bigger

I’m setting up this blog to document and reflect on some work I did on a dataset of aerobiological pollen measurements, to share methods I used and insights I gained.

A few weeks before last winter’s lockdown, in search for a real world dataset, mainly as an exercise for time-series analysis and visualisation as well as some predictive modelling, I started looking at data from the aerobiology station in Luxembourg (publicly available at pollen.lu).

It’s a great dataset, covering 30 continuous years of pollen measurements, taken at a daily frequency, of 33 different types of trees, grass and weeds. It also contains daily measurements of several types of fungal spores. The data are very clean and consistent, probably because, over the three decades, the measurements have been taken by the same team of people and the pollen trap was never moved.

The more I looked at the data, the more interested I got in it. Pollen research takes place at the unusual intersection of medicine (due to medical relevance of pollen allergies), botany (particularly phenology, which studies periodic events of biological life cycles), and meteorology (because pollen concentrations are largely determined by weather conditions).

Read more · 3 min read